

HE PEOPLE WHO design and build cities have a saying, or they used to: The mistakes of the planners are inherited by the health department. When basic city functions fail, people get sick.
So it makes sense, in a syllogistic sort of way, that the converse might also seem true: If people get sick in a city, the planners must somehow be at fault. When 193,000 people test positive for Covid-19 and nearly 16,000 die in New York City, the densest major urban concentration in the United States, maybe the closely woven fabric of the city itself is to blame. Both Governor Andrew Cuomo and Mayor Bill De Blasio said it straight-out: New York’s density makes it especially vulnerable to a respiratory disease pandemic—all those people crowding into subways, skyscrapers, studio apartments, Brooklyn coffee shops, and presumably Greenwich Village hep-cat jazz boîtes, asymptomatically exhaling the virus on each other and causing a catastrophe that could play out again in city after city without some posthaste suburbanization. “There are mechanistic reasons we would expect there to be more transmission in places where the population density was higher,” says Linsey Marr, a Virginia Tech researcher who studies airborne virus transmission. “I think there are more opportunities for transmission.”
It’s more complicated than that, of course. New York City has suffered from Covid-19 in ways disproportionate to its population, yes, but not because of density. At least, not the way most people understand the word.
One way to talk about density is through the number of people in a geographic space—population density, or people per square kilometer. New York City, with a density of about 10,000 people per square kilometer, reports 234 cases per 10,000 residents as of May 13. That’s a lot. Los Angeles, at about 3,300 people per square kilometer—reports 40.2 cases per 10,000 residents, and only 1,834 deaths, just about a tenth of New York’s.
Yet most cities defy the easy pattern. In China, the source of the Covid-19 outbreak, cities like Wenzhou and Xinyang, with lower population density than the locus in Wuhan, had more infections than high-density cities. Hong Kong, with an average density of 6,300 people per square kilometer, has 1.4 cases per 10,000. So it’s twice as densely populated as LA, but with a fraction of the caseload. And on the flip side, New Orleans, with a population density of 431 people per square kilometer, reports 1,718 cases per 10,000.
Or here’s another way to look at it: According to data assembled by the Financial Times, New York City has experienced a 408 percent increase in deaths from all causes since the beginning of the pandemic. But another global hot spot, Italy’s Bergamo province—with a population density that’s only a fifth of New York’s—has seen deaths increase just shy of 500 percent. That’s two places on opposite ends of the population-density continuum with similarly enormous increases in their death tolls.
One very good, albeit informal, analysis of density and Covid-19 comes from Robert McDonald of the Nature Conservancy and Erica Spotswood of the San Francisco Estuary Institute, writing on the Nature of Cities website. They crunched New York Times numbers to get the “attack rate”—infections per 1,000 people over time—for high-, middle-, and low-density counties and found only small differences among them. McDonald and Spotswood concluded that population didn’t predict outcomes anywhere near as well as, for example, how quickly cities instituted public health measures like school closures and stay-at-home orders.
THE CONNECTION BETWEEN health and cities is as confusing as the street grid in a medieval market quarter. Public health as a concept and field of study literally began with cities and infectious disease—from the 14th century, when officials at the port of Venice instituted a 40-day hold on ships to screen them for contamination (the quaranta, where we get the word quarantine) to the London physician John Snow connecting cholera to a contaminated community water source thanks to a well-drawn neighborhood map.
For most of their history, cities were less safe and less healthy than the world outside their walls. It’s fair to say that until the 19th century, people who lived in cities had shorter life spans than their country cousins. But then things flipped. Researchers argue over the reason: better nutrition, improvements in medical care, better sewers and general hygiene, environmental and occupational safety regulations, and all the other things that make cities nice.
The truth is, while the health of citizens was a concern, every change to cities in the interest of being “sanitary” also had quieter rationales behind it. Cholera outbreaks inspired the construction of Paris’ sewer system and the wide boulevards on the surface above it—which also gave the military better access to potential uprisings. Frederick Law Olmsted’s grand park designs, including Central Park in Manhattan, were also supposed to provide places where people from the crowded downtown neighborhoods, largely immigrants, could get away from the miasmas of disease—which city leaders thought were part of the immigrant experience. (Yeah, that was pretty racist, but then so was razing the African American neighborhood that stood where Central Park is now.) Part of the logic behind the first zoning laws in the United States, the 1916 rules that mandated setbacks for New York City skyscrapers, was to allow sunlight and fresh air to street level for health reasons. But it also helped balance the costs of building higher floors—as Carol Willis wrote in her 1995 book Form Follows Finance, at a certain point building enough elevators to serve wider, higher floors made the per-square-foot price of those upper floors too high. So the floor footprints had to get smaller.
Professionals recognized that cities could be the hubs of better health. In fact, in a series of articles in 1964, the American Journal of Public Health and the Nation’s Health issued a call for closer cooperation between urban planners and public health professionals—especially in the overlap between city housing and what used to be called “hygiene.” As the journal had in 1951. And in 1947. And in 1937. A 1917 article in the Journal of the American Medical Association—a full year before the influenza epidemic that would kill at least 20 million worldwide—argued that the single most valuable intervention a city public health department could undertake was home isolation of someone with an infectious disease. That same article also claimed that public health was a better way for cities to spend money than on individual physicians, because municipal programs could benefit more people.
This is one of the ways that gut instinct or common sense can screw you—at first it seems intuitive, even obvious, that a city would transmit more diseases, especially an invisible respiratory one that thrives on close-quarter contact. But at least since the 19th century, the best cities have done exactly the opposite. Cities can seem dangerous for all sorts of reasons, some of them deserved, but cities did after all start out as fortresses—against literal invasion, sure, but also against other more insidious harms. Cities are where the good hospitals are, the intense public health departments, the readiness to experiment. They are bulwarks against disaster.
But cities don’t protect all their inhabitants equally. The difference between the people who benefit the most from the walls (metaphoric and literal) and the people who benefit the least turns out to be more economic than anything else—a singular determinant of the particular kinds of space in the city that person occupies.
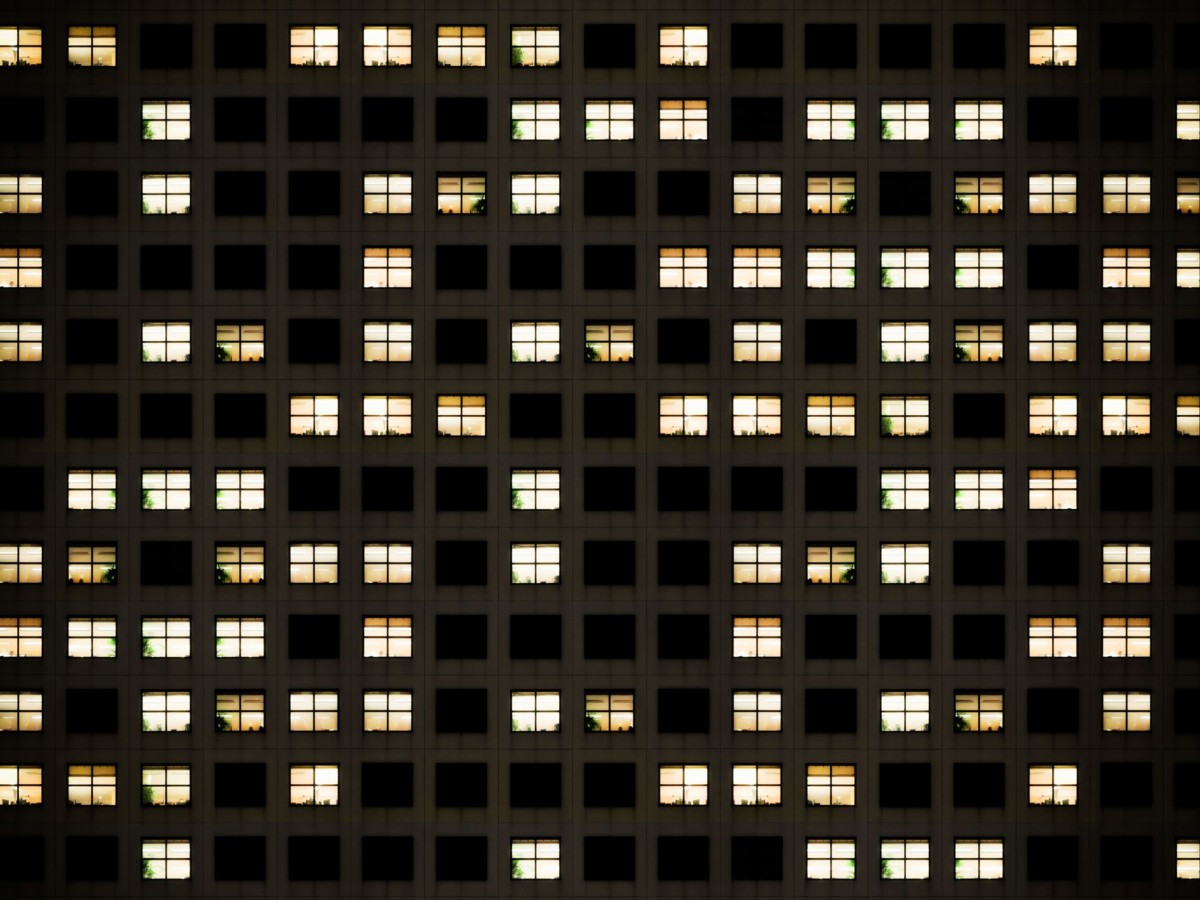
WHEN IT COMES to density, the trick is picking a scale. Covid-19 isn’t a problem of square kilometers, but one of square meters—of the number of people per unit of housing. Epidemiologists’ best idea about what’s happening here is that the virus is transmitted most easily when an infected person is in close contact with people for extended periods of time.
So in New York City, if you wanted to find those kinds of places, you might look to the subway. After all, 5.5 million people rode it every week before Covid-19. In fact, a working paper from an MIT economist attempted to make exactly that case—that the New York subway had been a vector for Covid-19, or at least the place where many New Yorkers got sick. The study mapped zip codes with higher infection rates per 10,000 people in all five boroughs and laid subway lines across them. It looked like they synced.
Mathematicians and epidemiologists quickly eviscerated the paper. More car-dependent parts of the city seemed to have higher rates of infection, said one. And the areas with higher infection rates didn’t actually map to subway lines, said another. Even if it was true, it’d mean something specific about New York’s subway, versus subway use generally, because other transit-dependent cities haven’t had the same problem. As Laura Bliss wrote at CityLab, Seoul—which has been tremendously successful at fighting the disease—has one of the world’s great subway systems, with 7 million riders a day.
It has to be something else, something at an even smaller scale—not a city, not a transit network, but perhaps a single room.
This science is all early days, hints and imprecations. One analysis by researchers in China of transmission among passengers and crew on the Diamond Princess cruise ship—a preprint, so not peer-reviewed, and relying on indirect accounts—showed that infections were vastly more common among passengers sharing cabins with other infected people, and among crew after quarantine measures went into effect. An analysis of an infection cluster in a restaurant in Guangzhou, China, claimed to show that people in the flow of an air conditioner unit and its exhaust fan picked up the infection while people at tables nearby did not. (The link isn’t as plain as it seems; the scale on the diagram published with the study suggests that the tables were farther away in reality than the map of the restaurant implies). An outbreak in a skyscraper in Seoul showed something similar—of the 97 people who got infected in the building, with both commercial and residential levels, 94 worked on a single floor. Of them, 79 were clustered in a cheek-by-jowl phone bank on one side of the building.
With the exception of the cruise ship, those are all urban examples. Here’s a rural one: A church in Arkansas continued to have in-person worship during the second week of March. Of 92 people who attended, 35 got sick, and they infected 26 more outside the congregation. Three people died. These kind of examples come up across less-dense, rural America. According to an analysis from the Associated Press, the 15 US counties with the highest per-capita infection rates from April 28 to May 5 all had one thing in common, and it wasn’t population density: They all had meatpacking or poultry processing plants, or a state prison.
Or consider Singapore.The city-state famously has sky-high population density, at 8,358 people per square kilometer. Yet thanks to rock-solid organization and experience from coronaviruses past, it had early, phenomenal success against Covid-19, with just about 800 cases through March. Most of them were imports from other countries. But then the disease made it to the cramped dormitories in which the city-state houses foreign laborers shoulder-to-shoulder, large groups living together. By May, Singapore had more than 17,000 cases.
Read all of our coronavirus coverage here.
The inequalities of cities intersect in the rooms where people live and work. “The densest blocks in New York are in Manhattan, and that is not where cases of coronavirus are most frequent. They’re most frequent in Brooklyn and Queens, and in poorer neighborhoods,” says McDonald, lead scientist at the Nature Conservancy and author of the Nature of Cities analysis. “In Manhattan you might have only two people in a studio apartment, and in parts of Brooklyn or Queens you might have a family of five or six people in a room that size.”
An analysis from the housing-focused Furman Center at New York University lays out this answer more starkly: Mortality rates were higher in neighborhoods with lower incomes and less density across the geographic space but more density in a given home. That is, more people sharing a room or an apartment. Parts of the city with more renters living in overcrowded conditions had higher levels of infection, even though they had lower population density. And where more people had college degrees, fewer people got sick—possibly because people without college degrees are less likely to be able to work from home, and more likely to be riding public transit and working with other people, all potential points of exposure to the disease.
Class and race differences manifest in differing risk. “For some people who have been exposed, or are experiencing symptoms, staying home is not always the obvious course of action,” says Molly Franke, an epidemiologist at Harvard Medical School. People who don’t have sick leave, who might lose their wages or jobs if they don’t show up, don’t have the option of sheltering in place. They’re out in the world, with more chances to encounter the disease and bring it home to the people they live with. And then, Franke says, things get even worse: “For a patient with Covid-19 to successfully isolate, there must be a separate bedroom and at least two weeks worth of supplies.” Who can afford all that?
On May 18, statistics finally confirmed what the Furman Center analysis had implied. The New York City Department of Health released numbers on deaths from Covid-19 by zip code, and the accompanying map is clarifying: The death rate has been higher in poorer neighborhoods where more people of color live. When Covid-19 came to New York City, rich people threw their Rimowa rolling bags into their Audi Q8s and decamped. But people who are less likely to have access to health care, less likely to have jobs they can do from home, more likely to share housing—as usual, they’re the ones who bear the brunt of the disease. Population density hasn’t been the issue, except on the spatial scale where it’s a proxy for inequality.
If a city really wanted to keep its residents safer from infectious disease, then, it might hearken back to the ideas in that 1917 JAMA article. If letting people shelter in place is valuable, people need shelters and they need places. Cities with more homes that people can afford can, by design, limit exposures (and, presumably, support more local businesses where residents might work, and so be able to walk or bike to their jobs instead of relying on confined spaces like buses or trains).
That old urbanist saying still holds, just not for the reasons people first thought. The mistakes of the planners did become the problems of the public health department—and of the hospitals, first responders, and families of the sick and the dead. But the mistake wasn’t too much density. It was making it the wrong flavor—failing to build enough housing so that everyone could afford safe places to live, both in terms of crime, sure, but also by any other metric. It was failing to figure out how to keep health care cheap enough for everyone to have ready access to it. It was turning personal space into a luxury afforded only to the rich, while giving away real estate to personal automobiles that made pollution and congestion worse while crowding poorer people into worse and worse conditions. That’s how cities have become places that exclude everyone but the rich and the white—and the baristas, waitstaffers, cooks, drivers, and cleaners who provide them with services.
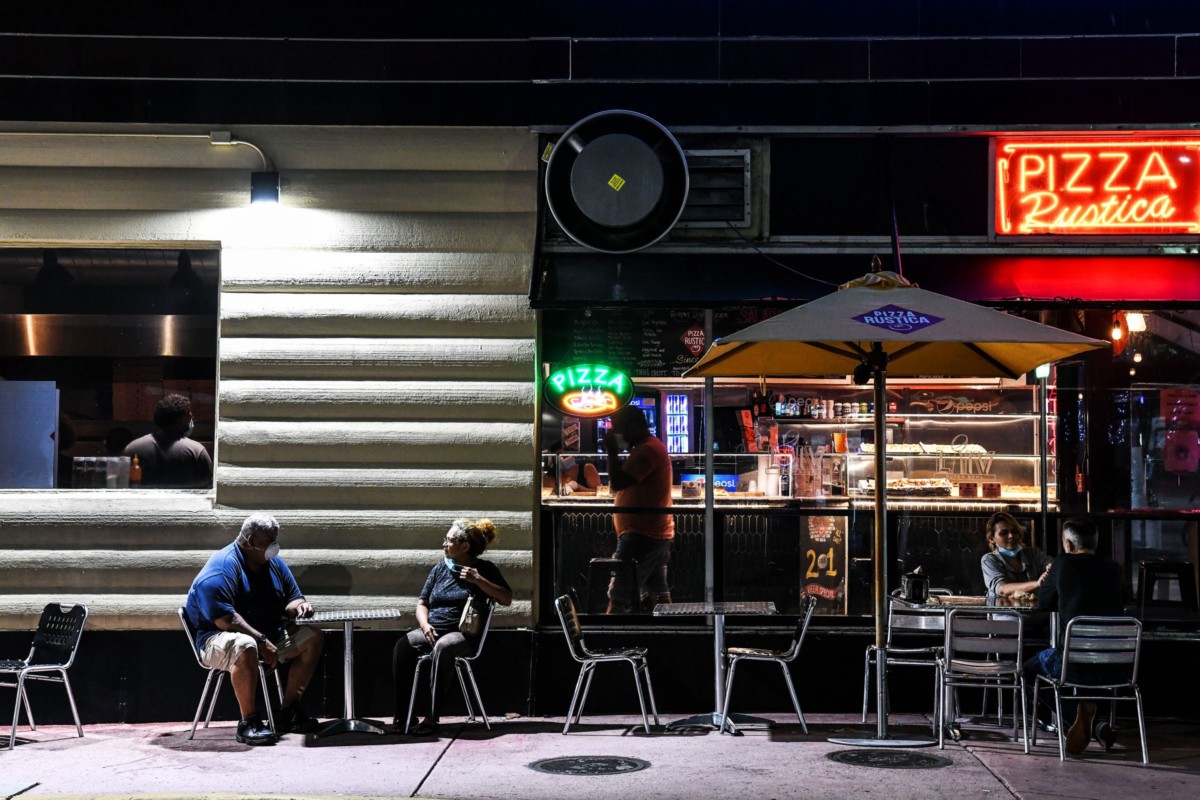
Covid-19 is going to force planners and politicians to rethink cities. They might put restaurants outdoors in spaces that used to belong to cars, putting open air between people and the virus. They might give more space to greenery and bike paths, so people scared to ride buses and subways because of a virus might still get where they want to go. Amid death and tragedy, there is opportunity to build places where all kinds of people can live. Planners might’ve made some of these mistakes—but they can also fix them.